
How to establish metrics in your Java application
Photo by Luke Chesser on Unsplash
Monitor the metrics of your application is a good way to discover any issue or problem that can be happening in production. If you are only reading the logs of your application to detect possible problems you are not seeing the full picture. In this post I will explain how to add application metrics to a Java backend application.
1 - Define your KPI’s
The first thing that you have to do is to define some key performance indicators (KPI) that will help you identify if there is a problem in your application. Example of KPI’s:
- Number of requests
- Number of responses
- Number of errors
- Number of files uploaded to an FTP
- Number of files downloaded from an FTP
- Number of exceptions
- Time to write a file in the filesystem
- Average time a used api needs to respond
- Average time to read a file in the filesystem
Those are some examples to inspire you about which should be the metrics of your app. Every app is different and the metrics to validate that everything is fine may be different from one app to another.
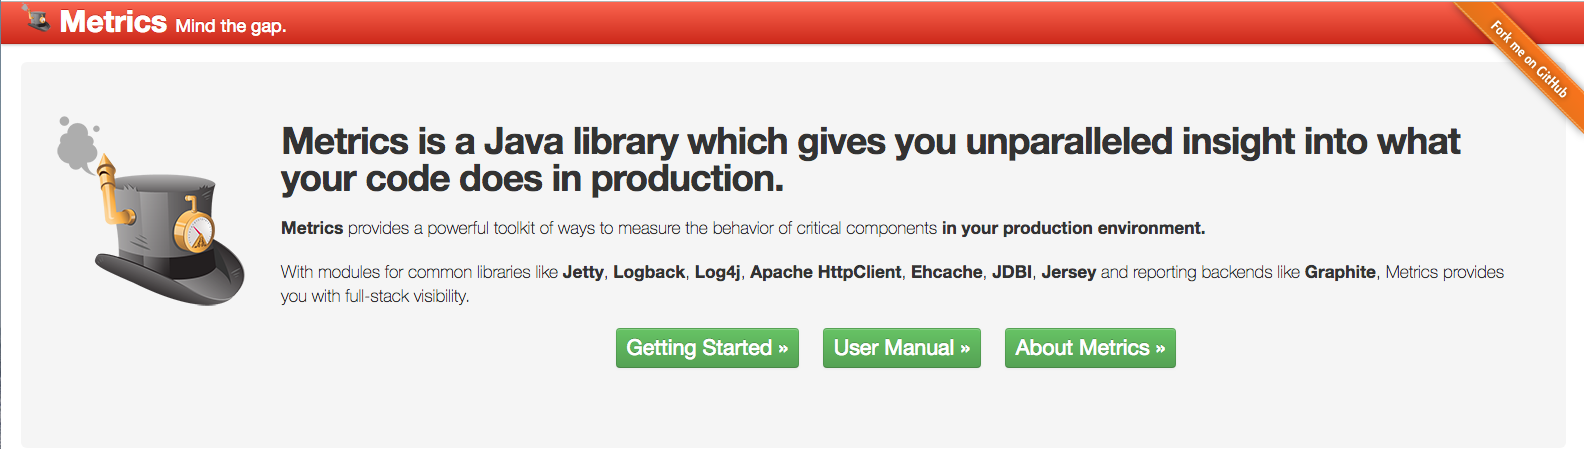
2 - Metrics dropwizard library.
In Java backend applications there is an open source Java library called Metrics that can help you measure the behaviour of critical components in production.
You have things like:
- Gauges
- Counters
- Histograms
- Timers
In the source code of your application you should add calls to Metrics library each time that you want to register some metric. I.e:
- increment a counter
- add a value to a histogram
- start a timer
- stop a timer
3 - Using Metrics in the code.
In the following pseudocode we can see how to code the start of a timer and the stop of it.
One important thing to notice is that MetricsRegistry is the container of all the application metrics. It should be considered to integrate in the lifecycle of your application using dependency injection, but static can be used also.
// get MetricsRegistry
// start timer
call to some service
// stop timer
In this example we can see how we can use a counter. The idea is to count events that mean something in your application.
// get MetricsRegistry
call
// call increment in a created counter
In the following one we can see how we would typically call add value to an histogram.
// get MetricsRegistry
call
// call add value to a histogram
To use this Java library in your application you need to add the dependency of metrics-core that has the main functionality. In case you are using Maven you can include your dependency using the following groupid and artifact (you should replace ${metrics.version} with the version that you want to use)
<dependencies>
    <dependency>
        <groupId>io.dropwizard.metrics</groupId>
        <artifactId>metrics-core</artifactId>
        <version>${metrics.version}</version>
    </dependency>
</dependencies>
or with Gradle:
dependencies {
    compile 'io.dropwizard:dropwizard-core:0.8.0'
}
4 - Using Graphite to store metrics.
Once you have added metrics library in your project you have to sent the metrics to some storage. One of the options that you can use is Graphite, but there are others like InfluxDB.
Graphite is a free open-source software (FOSS) tool that monitors and graphs the performance of computer systems. Graphite was developed by Orbitz and released as open source software in 2008. Graphite collects, stores, and displays time-series data in real time.
From the metrics library you have support to report data to Graphite:
final Graphite graphite = new Graphite(new InetSocketAddress("graphite.example.com", 2003));
final GraphiteReporter reporter =
           GraphiteReporter.forRegistry(registry)
                           .prefixedWith("web1.example.com")
                           .convertRatesTo(TimeUnit.SECONDS)
                           .convertDurationsTo(TimeUnit.MILLISECONDS)
                           .filter(MetricFilter.ALL)
                           .build(graphite);
Graphite does two things:
- Store numeric time-series data
- Render graphs of this data on demand
What Graphite does not do is collect data for you (Metrics library does)
In the following link you can find information on how to install Graphite in a Linux server.
5 - Connecting metrics storage with Grafana.
Grafana is a open platform for analytics and monitoring. From heatmaps to histograms. Graphs to geomaps. Grafana has a plethora of visualization options to help you understand your data.
You can also define alerts where it makes sense — while you’re in the data. Define thresholds visually, and get notified via Slack, PagerDuty …
In Grafana you should select the datasource from where you want to pick data. It’s easy to connect Grafana with Graphite.
6 - Using Grafana metrics editor.
In the following gif you can see an animation where a metric is being selected in the metrics editor.
Imagine that you have the next metric:
server.<server_name>.orders.pos.<pos_name>.countWhere server_name and pos_name can have more than one value. You can choose between to use a wildcard (to visualize all values) or select one of the possible values.
In this case we want to monitor all orders in france POS.
server.*.orders.pos.france.countIn the next case we want to monitor all the orders in france POS in server2
server.server2.orders.pos.france.countIn the next one you want to check in the server3 the orders for all POS.
server.server3.orders.pos.*.countIt’s not recommended to use it when you have an identifier of something that is unique like orderId that never repeats. But if you have a set of values it’s a good candidate.
I.e: You could use it to count the different kind of exceptions that we have in a particular server like NullpointerException, ConnectException, TimeoutException …
server.<server_name>.exceptions.<exception_name>.countIf we detect that the number of NPE has increased it means that maybe we have introduced some bug in the software in the last release.
7 - Defining alerts in Grafana
You can have the best Dashboards of the world but if you don’t configure alerts for your metrics you won’t be aware when there is a problem. You don’t have to check the metrics everyday manually, if you configure properly the alerts you can receive an email or an slack notification.
In the following links you have more information of how to configure the rules for alerts and how to configure notifications
Conclusion
Having metrics in your application is a good way to monitor the health of your application and see if your KPI’s are met or not. In this post I walked through a possible setup configuration for a Java backend application using Metrics, Graphite and Grafana.
Comments