
Improving performance of JPA queries
Why use JPA?
JPA stands for Java persistence api and describes the management of relational data in applications using the Java platform.
One important thing of JPA is the concept of persistence entity. An entity it’s a lightweight java class whose state is typically persisted to a table in a relational database. Instances of such entity are rows in a table.
JPA is a java standard defined in the Java community process which is a formalized mechanism that allows interested parties to develop standard technical specifications for Java technology.
Using something standard is a good practice when using technology and using JPA is not an exception.
The task
One of the last development tasks that I had to do has been to reduce the time that an API rest operation spend when calling it.
To test the API I was using Postman application because it has a lot of features available to test web API’s.
The application was written in Java 8 using JBoss 6.4 GA and the persistence of the application was managed by JPA and hibernate. The database management system was Oracle 11g.
Bad performance in the API
The operation getAllCampaigns() returned a JSON with all the entities and it was spending 120 seconds to retrieve 95 campaigns from the database.
One of this campaigns had 20000 codes that were in the Code table and also had conditions in other table conditions.
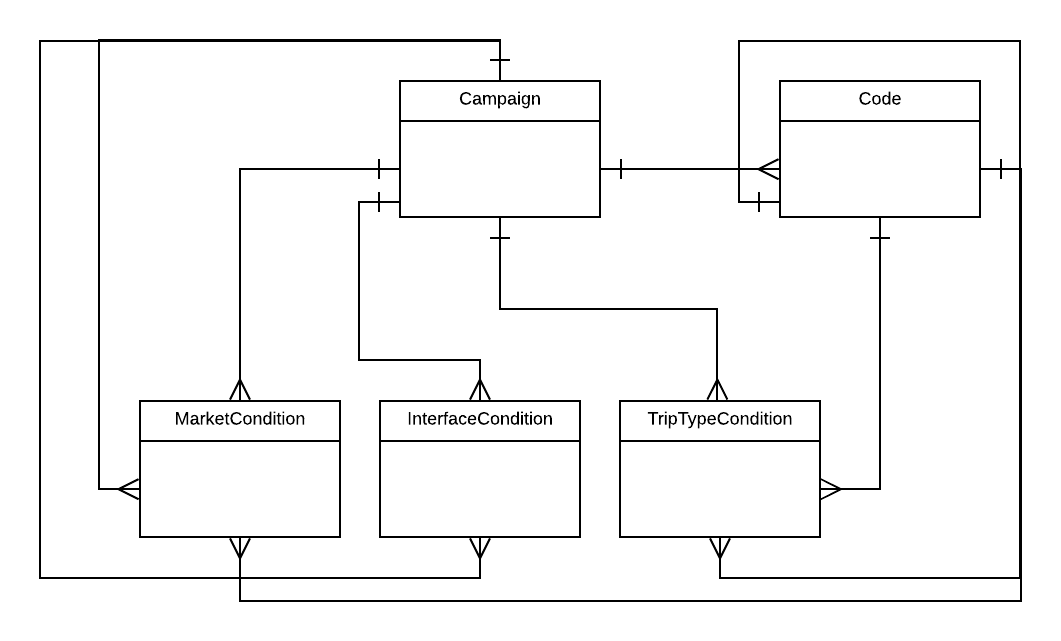
The number of joins to do in the operation getAllCampaigns() was high and I should find a better way to query the data.
Printing logs
The first thing that I did was to activate in the persistence.xml the following properties:
<property name="hibernate.show_sql" value="true"/>
<property name="hibernate.generate_statistics" value="true" />
<property name="hibernate.format_sql" value="true"/>
<property name="hibernate.use_sql_comments" value="true"/>
and in the log4j.properties I added also the following lines:
# basic log level for all messages
log4j.logger.org.hibernate=info

# SQL statements and parameters
log4j.logger.org.hibernate.SQL=debug
log4j.logger.org.hibernate.type.descriptor.sql=trace
log4j.logger.org.hibernate.stat=debug
This way I was able to show sql in the logs, generate statistics, format the sql and having sql comments to understand better which queries where being executed.
Checking statistics
The surprise was that a lot of queries to the database were executed for a single API operation:
2018-09-19 11:17:56,656 INFO  [http-0.0.0.0:8080-1: : ] [StatisticalLoggingSessionEventListener] - Session Metrics {
    306789321 nanoseconds spent acquiring 35595 JDBC connections;
    137441803 nanoseconds spent releasing 35595 JDBC connections;
    776012325 nanoseconds spent preparing 35595 JDBC statements;
    44350389007 nanoseconds spent executing 35595 JDBC statements;
    0 nanoseconds spent executing 0 JDBC batches;
    58259175 nanoseconds spent performing 4646 L2C puts;
    0 nanoseconds spent performing 0 L2C hits;
    176674 nanoseconds spent performing 1 L2C misses;
    47106855 nanoseconds spent executing 1 flushes (flushing a total of 4645 entities and 35594 collections);
    5540 nanoseconds spent executing 1 partial-flushes (flushing a total of 0 entities and 0 collections)
}
35595 JDBC connections were done to the database. If this API has to be used by a high number of users this was not acceptable.
I realize that there was a problem of n+1 select query issue problem in ORM https://stackoverflow.com/questions/97197/what-is-the-n1-select-query-issue
Using FetchType.Eager
Then I tried to set anotation FetchType.EAGER that according to the book Java Persistence with Hibernate 2007, it was one of the ways to fix this problem because it forces to make joins with the related entities instead of doing a query for each row related with the an entity.
@Embeddable
public class CampaignConditionsEntity implements Serializable {

@ElementCollection(fetch = FetchType.EAGER)
@CollectionTable(name = "TRIP_TYPE_CONDITION", joinColumns = @JoinColumn(name = CAMPAIGN_ID))
private Set<TripTypeConditionEntity> tripTypeConditions;
The problem was that the related tables with the main entity were using @ElementCollection and the number of queries after executing this change was the same as before.
Using Join fetch
I tried then with a JPQL query that did JOIN FETCH because according to JPA 2.2 specification (JSR 338):
A FETCH JOIN enables the fetching of an association or element collection as a side effect of the execution of a query.
The first attempt of this optimization was with JOIN fetch. It returned no results because there were some relationships that have no related rows and because of that I had to use LEFT joins instead of that.
The results were the ones expected for a single operation: 1 JDBC connection. However, time to retrieve the data for this query was still 8 seconds:
2018-09-19 11:36:17,733 INFO  [http-0.0.0.0:8080-1: : ] [StatisticalLoggingSessionEventListener] - Session Metrics {
    366522 nanoseconds spent acquiring 1 JDBC connections;
    7645 nanoseconds spent releasing 1 JDBC connections;
    538334 nanoseconds spent preparing 1 JDBC statements;
    674436612 nanoseconds spent executing 1 JDBC statements;
    0 nanoseconds spent executing 0 JDBC batches;
    108560425 nanoseconds spent performing 4664 L2C puts;
    0 nanoseconds spent performing 0 L2C hits;
    0 nanoseconds spent performing 0 L2C misses;
    47723651 nanoseconds spent executing 1 flushes (flushing a total of 4664 entities and 35879 collections);
    5627 nanoseconds spent executing 1 partial-flushes (flushing a total of 0 entities and 0 collections)
}
Next calls to the operation spend 2.8 seconds approximately. I wonder if JPA/hibernate Level 1 cache was caching some way our database query, but what I did was to get the raw query and execute it directly in the oracle sql developer. The first execution was slow and next ones were faster.
Reviewing the query plan
I thought that this query could be improved and I checked the query plan in the sql developer
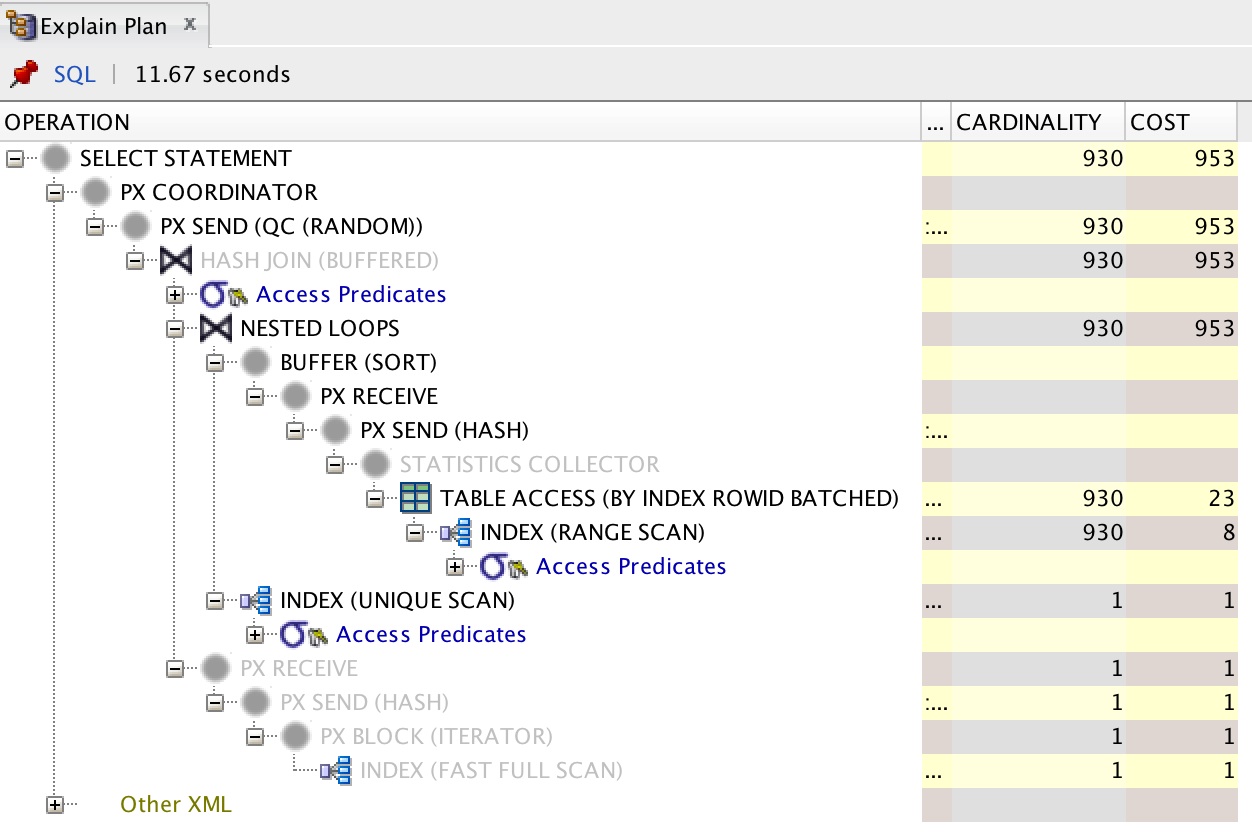
I found that there was an order by that was adding a cost that could be reduced. I had to delete @OrderBy annotation in one of the entities that was increasing the query time. This helped to reduce the time of the query to 2.8 seconds in the first execution.
Conclusion
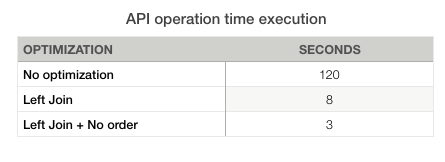
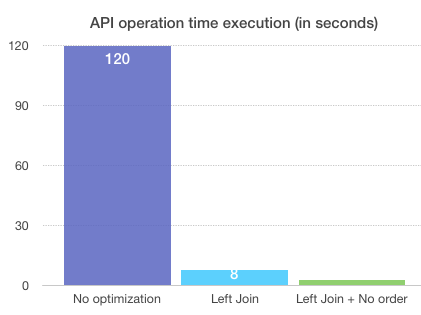
Using a left join was a good option to decrease the time that the API operation spent in time, because JPA was doing a lot of queries to the database and it increased a lot the time to get the data requested through the API operation. In the following charts you can see a summary with the reduction of time for each optimization. In this case was a good option but it depends on the database design. I recommend the book Java Persistence Hibernate in action where it explains in more detail how to optimize your queries.
Comments